12 Ensuring Data Quality
12.1 Learning Outcomes
By the end of this section, you should:
- understand the basic processes involved in ensuring high-quality data;
- demonstrate a secure understanding of data validity, and why it is important.
12.2 Introduction
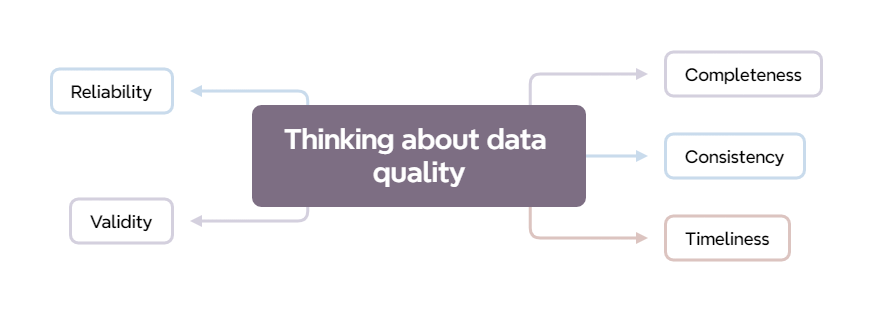
The questions in the previous section partly address the issue of data quality. In other words, are you certain that your data is accurate, consistent, and complete? Confirming these aspects of your data is crucial for producing reliable and valid insights from the analysis.
Essentially, examining data quality is intended to confirm that the data represents the real-world entities or events it is intended to describe, and that the data is free from errors and mistakes. It is also about making sure that all the steps you take, from first identifying the dataset through to completing your analysis, are conducted transparently and in a replicable manner.
If you are unsure that your data is of high quality, you’ll never be confident in the results of any subsequent analysis, no matter how compelling your results may be!
You should therefore take time to reflect on each of the following criteria prior to beginning any manipulation or analysis of the data.
Some of the steps that follow this (e.g., data pre-processing) are intended to address any issues that you might identify in the data.
12.3 Completeness
This refers to the extent to which all necessary data points are present in a dataset, without any missing values or gaps, allowing for a comprehensive analysis of the information. In other words, is all the information you will require to undertake your analysis present in the dataset?
If it’s not, there’s no point continuing!
12.4 Consistency
The term ‘consistency’ is used in data analytics1 to describe the uniformity and reliability of a dataset in terms of its format, structure, and measurement scales across a dataset.
Data ‘consistency’ means that data values follow a standardized and harmonized format, making the dataset easy to process, analyse, and interpret. When data analysts mention consistency in their data, they are typically referring to things like:
Consistent formatting: Data values should adhere to a standard format or structure, such as date and time formats, text capitalisation, or number formatting. This also applies to how variables are named, which we discussed earlier.
Consistent units of measurement: All values within a variable should use the same unit of measurement (e.g., meters, kilograms, or dollars) to facilitate comparison and analysis.
Consistent encoding: The dataset should use a consistent character encoding, such as UTF-8, to ensure proper handling of text data, including special characters and non-Latin scripts. You can run into problems when your text/string variables use characters that are not understood by your analysis software.
Consistent terminology and categorisation: The dataset should use standardised terms, abbreviations, and categories to ensure that similar information is consistently represented across the dataset. It’s important to strike a balance between brevity (i.e. using short variable or label names) and clarity (i.e. using terms that can be easily understood by others).
Consistent treatment of missing data: Missing data should be represented uniformly across the dataset, usually using NA or NULL values, to facilitate accurate identification and handling of missing data during the analysis (we will cover this in more detail later in the module, Section 14.4).
Maintaining data consistency is essential for conducting reliable and accurate data analysis. Inconsistent data can lead to errors, misinterpretations, and biases in the results of the analysis, undermining the validity and reliability of the findings.
Data analysts often spend a significant amount of time cleaning and pre-processing their data to ensure consistency before performing any analysis.
12.5 Timeliness
The relevance and freshness of data, ensuring that the information is up-to-date and reflects the most current state of the entities or events it represents. If you are working with a dataset from a group of athletes that was collected a year or more ago, are you sure that it is still meaningful now?
12.6 Validity
12.6.1 Introduction
The validity of your data is a critical, and often overlooked, aspect of conducting a meaningful analysis. It is something that is usually considered when data collection is being planned, and there are limited solutions that can be applied to data after it has been collected.
Therefore, when you set out to work with a new dataset, you should ask yourself how you can be sure that the data adheres to criterion of being ‘valid’.
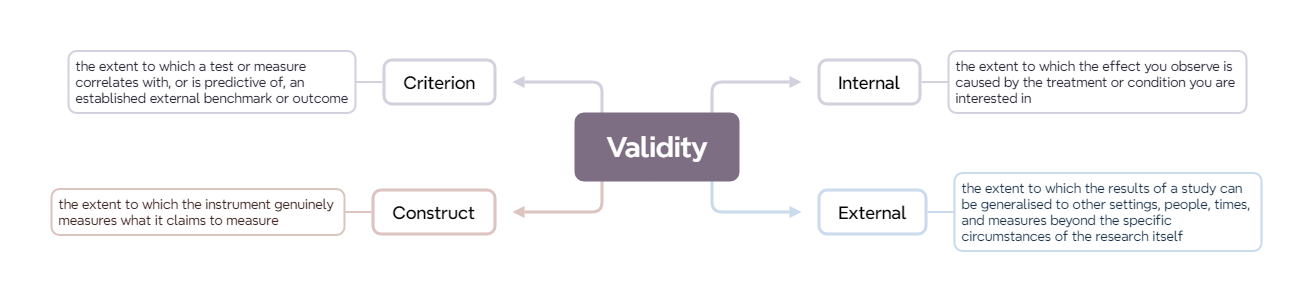
In data analysis, ‘validity’ refers to the extent to which a measurement, test, or study accurately reflects or assesses the concept it is intended to measure.
For example:
‘Internal’ validity describes the extent to which the results of a study can be attributed to the treatment or variable being studied rather than other factors.
‘External’ validity describes the degree to which the results of a study can be generalized to other settings, people, times, and measures.
‘Construct’ validity describes the degree to which a test or measure accurately assesses the theoretical concept it is intended to measure.
‘Criterion’ validity describes how well a test or measure correlates with an established, external benchmark or outcome.
12.6.2 Internal Validity
12.6.2.1 What is ‘internal validity’?
‘Internal’ validity describes the extent to which the effect you observe is caused by the treatment or condition you are interested in, rather than other things.
For example, you may be exploring the relationship between body temperature and heart rate in athletes. Strong internal validity will include measures to account for other things that affect body temperature, such as the temperature of the environment.
12.6.2.2 How can internal validity be threatened?
Here are some of the most common threats we encounter that can cause problems with data validity.
Confounding variables: these are factors other than the independent variable that may cause a change in the dependent variable, and thus interfere with the true relationship between the variables we’re exploring. For example, when studying the effect of a new training regimen on athletes’ performance, if some athletes are taking performance-enhancing supplements unknown to the researchers, this could confound the results, making it unclear if improvements are due to the training regimen or the supplements.
Selection bias: this is where there is a systematic difference in the groups being compared in a study due to the way participants are selected or assigned. For example, a coach wants to determine the effectiveness of a new training drill, and selects the most skilled players to participate in the new drill while leaving out the less skilled. If the skilled group performs better, it might not be due to the drill but because they were already better players to begin with.
Maturation: this describes changes in participants over time that could affect the outcome of the study. For example, in a year-long study examining the effects of a new workout routine on young athletes, the observed performance improvements might be due in part to the natural growth and development of the athletes, rather than just the workout routine.
History: sometimes, events that occur outside of the study that could have an effect on the outcome of the study. For example, a study aims to determine the morale boost of a new team-building exercise in netball, but midway through the study, the team wins a major trophy. The increased morale might be more attributable to the win than the team-building exercise.
Instrumentation: it’s important to remember that changes in the measurement tools or procedures can affect the consistency and reliability of data collection. For example, a research study uses two different stopwatches to measure sprint times at the beginning and end of a season. If one stopwatch is slightly off in its timing, it could incorrectly suggest that there’s been a significant change in the athletes’ performance over the season.
12.6.2.3 How might we improve internal validity?
Having identified potential challenges to internal validity, what can we do about it? Common responses include:
Randomisation, a technique where participants are randomly assigned to different groups, ensuring each group is comparable and minimizing the influence of confounding variables.
- For example, a study aims to test the effectiveness of a new training regimen on improving soccer players’ speed. Researchers randomly assign half the participants to the new training regimen and the other half to the traditional regimen to ensure that any differences in outcomes are likely due to the training methods rather than other factors.
Control Groups, where one group in an experiment that does not receive the treatment or intervention, serving as a baseline to compare against the experimental group(s).
- For example, in a study investigating the benefits of a new dietary supplement for cyclists, one group of participants might be given the supplement (which we often call the ‘experimental’ group), while another group is given a placebo (‘control’ group). By comparing the performance enhancements between the two groups, we can ascertain if any observed improvements are genuinely due to the supplement.
Matching, a technique where participants with similar characteristics or scores on a particular variable are paired together and then split between the treatment and control groups, ensuring that groups are equivalent on specific potential confounding variables.
- For example, a study wants to evaluate the effectiveness of a rehabilitation program for tennis players recovering from shoulder injuries. To account for differences in age, researchers pair players of similar ages together and then assign one player from each pair to the rehabilitation program and the other to a standard recovery regimen. This ensures that age-related recovery differences don’t confound the study’s results.
12.6.3 External Validity
12.6.3.1 What is ‘external validity’?
External validity refers to the extent to which the results of a study can be generalised to other settings, people, times, and measures beyond the specific circumstances of the research itself. It’s essentially about the generalisability of our study findings to situations outside our study’s parameters.
12.6.3.2 How can external validity be threatened?
There are quite a number of different ways in which external validity can be threatened, especially in ‘messy’ data collection settings such as sport which are often not controlled. Some examples include:
the interaction of selection and treatment: this threat arises when the participants selected for the study respond to the treatment differently than others might, making it difficult to generalise the findings to a broader population.
- Imagine a study that claims a specific training regimen improves the speed of sprinters. If the participants chosen for the study were already the fastest sprinters from a particular region, they might have unique characteristics or genetic advantages. Therefore, this regimen might not work as effectively on average sprinters or those from other regions.
the interaction of setting and treatment: this threat to external validity occurs when the effect of the treatment is bound by the specific location or environment where the study took place, meaning the results might not be generalisable to other settings.
- For example, a study conducted in high-altitude regions claims that a certain breathing technique improves stamina in long-distance runners. However, the results may not apply to runners training at sea level, as the high-altitude setting uniquely influences lung capacity and oxygen consumption.
the interaction of history and treatment: this threat emerges when the effect observed in the study is influenced by specific events occurring at the same time as the treatment, making it unclear if the results would replicate in different time periods.
- For example, let’s say a study finds that a new motivational coaching technique leads to better team performance. However, during the study, a significant event like a major sports scandal related to the opponent team occurs, which might demoralise them and impact their performance. The improved performance might then be more related to this external event than the coaching technique.
12.6.3.3 Strategies for improving external validity
There are a few things we can do to improve the external validity of our data. For example:
Replication, which means repeating a study or experiment under different conditions or with different participants to see if the results can be consistently produced.
Sampling, where we select participants in a way that they are representative of a larger population, allowing for the generalisation of results to that broader group.
- For example, a researcher wants to understand the dietary habits of professional football players. Instead of just studying players from one team or one country, they gather a sample that includes players of different ages, genders, nationalities, and playing positions. This more diverse sampling allows the findings to be generalized to a broader population of football players.
12.6.4 Construct Validity
12.6.4.1 What is ‘construct validity’?
Basically, construct validity ensures that the instrument genuinely measures what it claims to measure. It assesses whether the operational definitions used for study variables truly reflect the conceptual meanings of those variables.
12.6.4.2 How can construct validity be threatened?
Some ways in which construct validity can be threatened within a research study include:
Inadequate definition of constructs: a situation in which the concepts or variables being studied are not clearly or accurately defined, leading to confusion or misinterpretation.
- For example, suppose a study aims to measure “athleticism” in football players but defines athleticism solely based on the player’s sprinting speed. This would be an inadequate definition since athleticism in football should encompass other factors such as agility, strength, endurance, and skill.
Mono-method bias: relying on a single method or tool to collect data, leading to potential systematic errors or biases because of the limitations of that particular method.
- Consider a study that tries to assess the mental toughness of tennis players solely through self-report questionnaires. By not including other methods like observational data or interviews, the study could miss nuances or introduce biases related to self-perception.
Mono-operation bias: Definition: this describes the use of only one operationalisation (or version) of a concept or variable, limiting the study’s generalisability and potentially overlooking other relevant aspects of the construct.
- For example, imagine a research study that aims to assess the effectiveness of a new basketball training drill in improving shooting accuracy. If the study only tests this drill with professional male players and doesn’t consider other populations (e.g., female players, amateur players, or youth players), then the findings might not generalize to these other groups.
12.6.5 Criterion Validity
12.6.5.1 What is ‘criterion validity’?
‘Criterion validity’ is the extent to which a test or measure correlates with, or is predictive of, an established external benchmark or outcome.
Imagine a group of researchers develop a new test to assess the endurance levels of marathon runners. To establish criterion validity, they correlate scores from this new test with actual marathon finishing times. If a strong negative correlation emerges (i.e., higher scores on the test are associated with faster (lower) marathon times), it provides evidence of criterion validity for the new endurance test.
12.6.5.2 Types of criterion validity
There are two main types of criterion validity that you are likely to encounter when reading or conducting research:
Concurrent validity: describes the extent to which a test or measurement correlates with other established tests of the same construct. High correlation suggests that the test or measure is doing a good job at capturing what it is intended to capture.
Predictive validity: describes the extent to which a test or measurement can accurately predict what is going to happen in the future. High predictive validity suggests that the test or measure is doing a good job at capturing what it intended to capture.
12.6.5.3 Strategies for assessing criterion validity
Correlations with established measures
Regression analysis
12.6.6 Addressing Validity in the Data Analysis Process
From what we’ve covered in this section, you’ll realise that ensuring validity is of paramount importance. The results and conclusions drawn from an analysis are only as strong as the validity of the methods and data used.
So you may be wondering how we can bolster validity at various stages of the data analysis process. Some solutions are presented below, though we need to remember that you may not be involved in the data collection at an early enough stage to undertake these.
We will return to some of these concepts and techniques in the B1705 Research Methods module. For now, just try to get a general sense of the key issues and concepts.
12.6.6.1 At the data collection stage
Purpose Alignment: Begin by ensuring that the data collected aligns with the research question or analysis purpose. For instance, if studying aerobic endurance in long-distance runners, heart rate data might be more pertinent than, say, grip strength.
Instrument Calibration: Regularly calibrate measuring instruments. For instance, if using wearable devices to track player movement, ensure their accuracy and precision, possibly by cross-referencing with video analysis.
Sampling Strategy: Ensure your sample is representative of the broader population. If analysing the dietary habits of swimmers, including individuals from various age groups, competitive levels, and both genders can enhance external validity.
12.6.6.2 During data pre-processing
Data Cleaning: Address outliers, missing values, and potential measurement errors. If a soccer player’s recorded speed exceeds known human limits, it’s likely a measurement error.
Normalisation and Transformation: Different scales and units across datasets can introduce validity threats. Ensure all data, such as timings from various events, are on comparable scales.
Feature Selection: Only include variables pertinent to the research question, ensuring the analysis remains focused and relevant. For instance, when analyzing factors affecting sprint performance, wind resistance might be relevant, but the brand of athlete’s shoes might not.
12.6.6.3 During statistical analysis
Appropriate Model Selection: Employ statistical models appropriate for the data type and distribution. Using a linear regression model for categorical outcomes can threaten validity.
Cross-validation: Implement cross-validation techniques, such as k-fold cross-validation, to assess the model’s prediction performance on unseen data, ensuring that it’s not just fitting noise.
Check Assumptions: Many statistical tests have underlying assumptions. For instance, if using ANOVA to compare performances across different sports, ensure homogeneity of variances.
12.6.6.4 When interpreting your results
Effect Size Over P-Value: While p-values indicate statistical significance, effect sizes provide insight into practical significance. A small change in a basketball player’s shooting percentage might be statistically significant but not practically impactful.
Avoid Overgeneralisation: Based on the sample and research setting, know the boundaries within which the findings apply. If a technique improves performance in indoor conditions, it might not necessarily translate to outdoor settings.
Acknowledge Limitations: Recognise and articulate any limitations in the data, method, or external factors. For instance, if assessing a training technique during off-season, acknowledge that competitive season dynamics might differ.
12.7 Reliability
Along with validity, the reliability of your data is perhaps one of the most critical things to think about before conducting analysis. Reliability means that you get the same result when you repeat the data collection under the same conditions.
We will deal with this important topic later in the module.
Note that the term ‘consistency’ is used differently by statisticians, where it is most frequently used to describe a desirable property of an estimator. An estimator is said to be consistent if it converges to the true value of the parameter being estimated as the sample size increases. In other words, as more data points become available, the estimator will provide increasingly accurate estimates of the parameter.↩︎